Multi-Timeframe Analysis
Looking at only one chart timeframe can provide an incomplete picture of a stock's behaviour. Multi-timeframe analysis helps investors understand the bigger trend while also identifying developing opportunities on shorter timeframes. Throughout EdgeBreak, combining multiple timeframes provides valuable context when researching breakout structures and market strength.
What You'll Learn
- What multi-timeframe analysis is.
- Why experienced investors use more than one chart.
- How weekly, daily and intraday charts work together.
- How multiple timeframes support breakout research.
- Common mistakes when analysing different timeframes.
Why Multiple Timeframes Matter
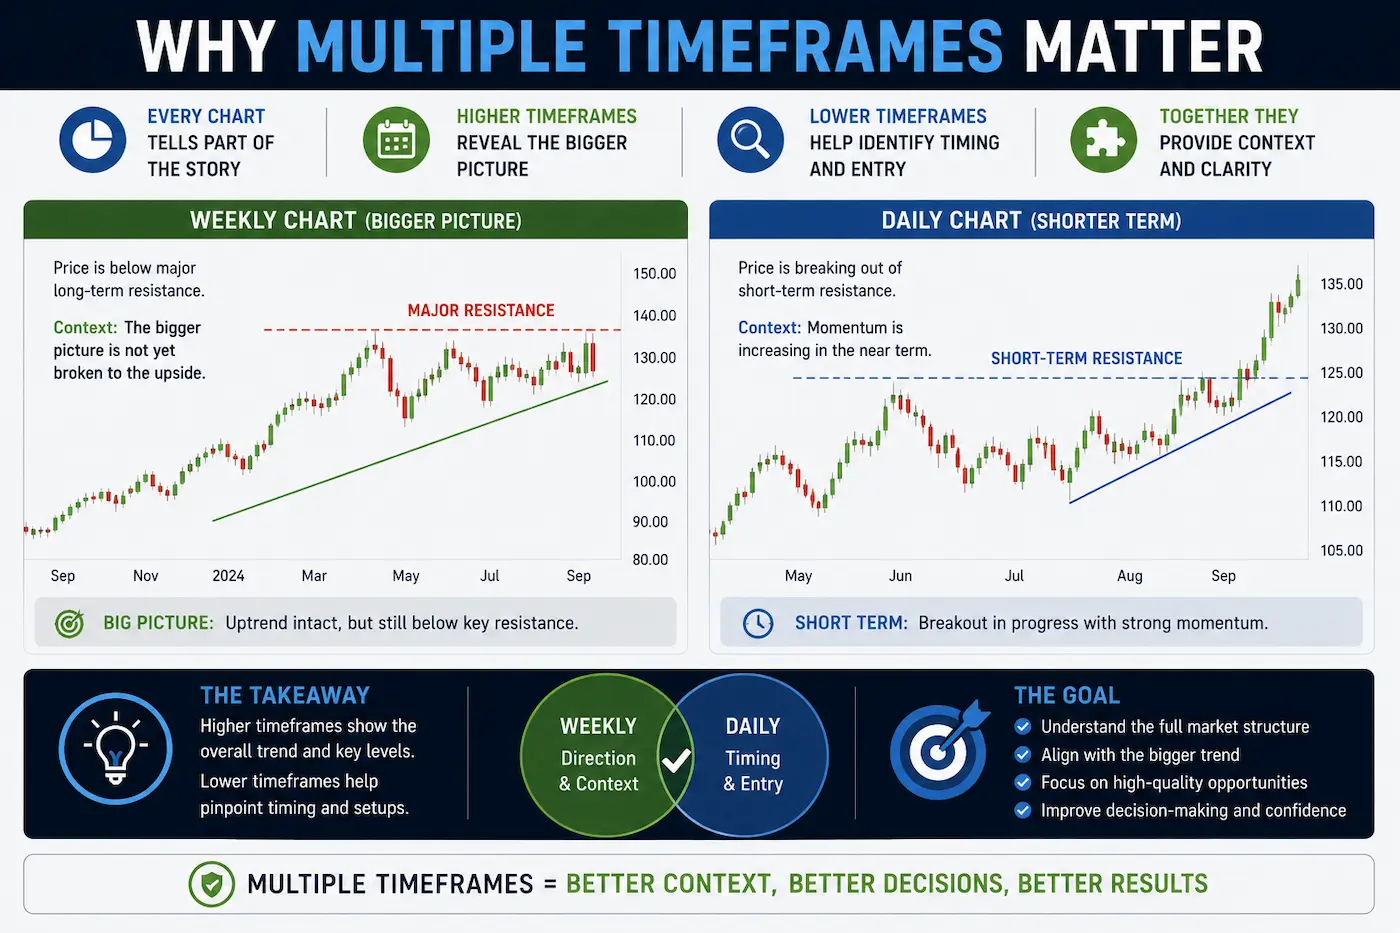
Every chart tells part of the story.
A daily chart may show a developing breakout, while the weekly chart reveals the stock is still trading below major long-term resistance. Likewise, a stock may appear weak on a short-term chart but remain in a healthy long-term uptrend.
By viewing several timeframes together, investors gain a broader understanding of market structure before focusing on smaller price movements.
The Weekly Chart
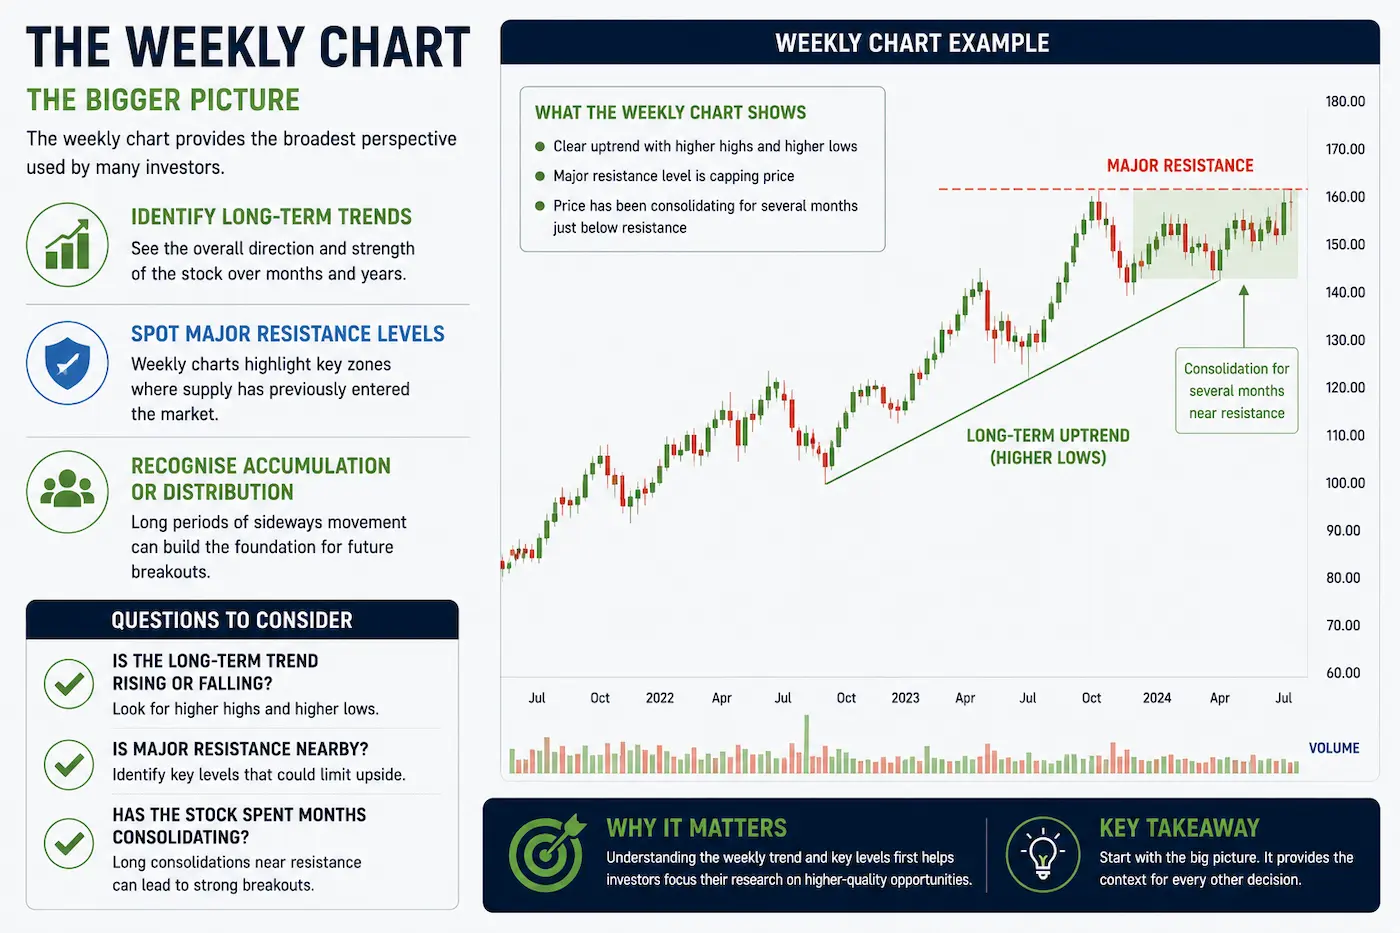
The weekly chart provides the broadest perspective used by many investors.
It helps identify long-term trends, major resistance levels and significant accumulation or distribution that may not be obvious on shorter charts.
Before researching a breakout, it is often useful to understand where the stock sits within its larger market structure.
Questions to consider include:
- Is the long-term trend rising or falling?
- Is major resistance nearby?
- Has the stock spent months consolidating?
The Daily Chart
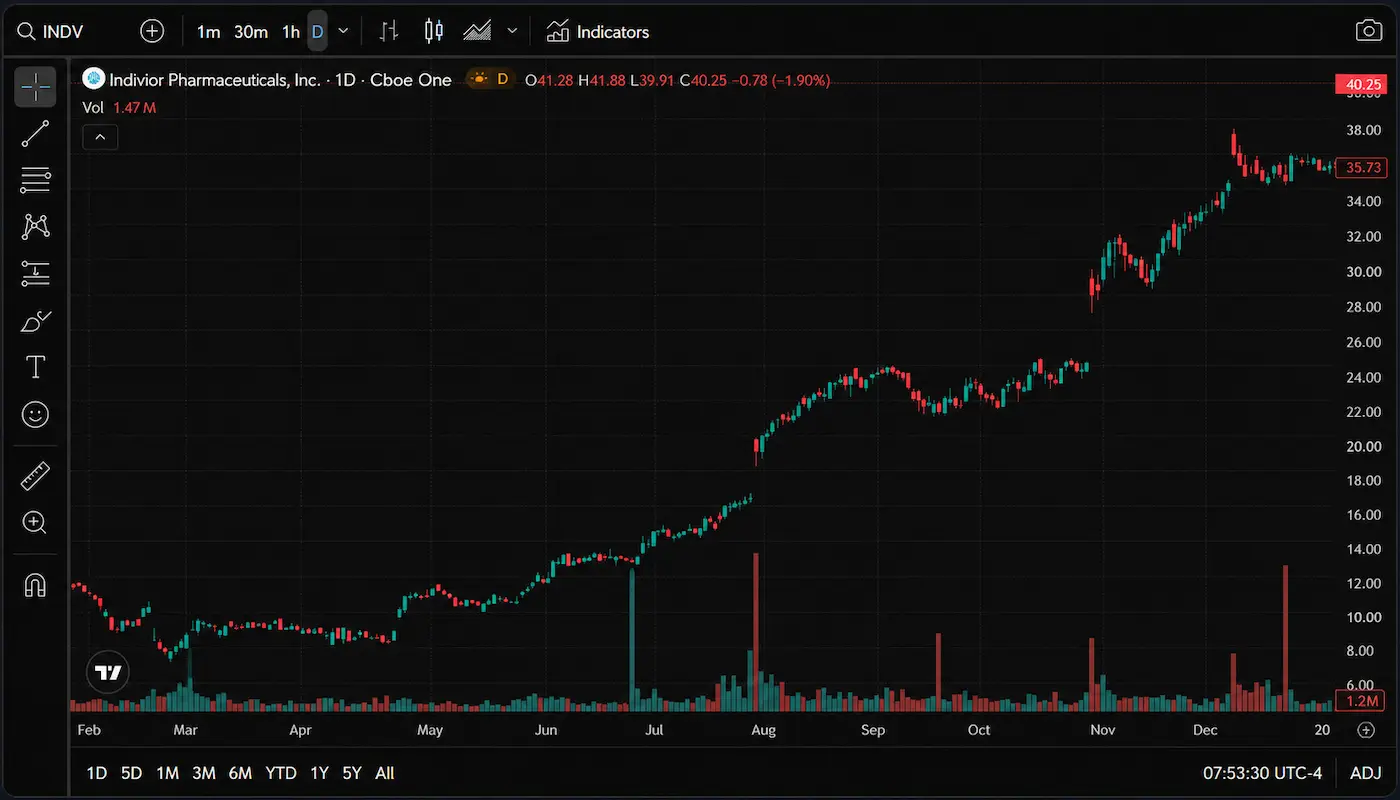
The daily chart forms the foundation of the EdgeBreak research process.
This is where investors can study resistance touches, higher lows, volume behaviour, accumulation characteristics and developing breakout structures.
Most of the scanners within EdgeBreak analyse daily market behaviour because it provides a balance between long-term trends and shorter-term price action.
Intraday Charts
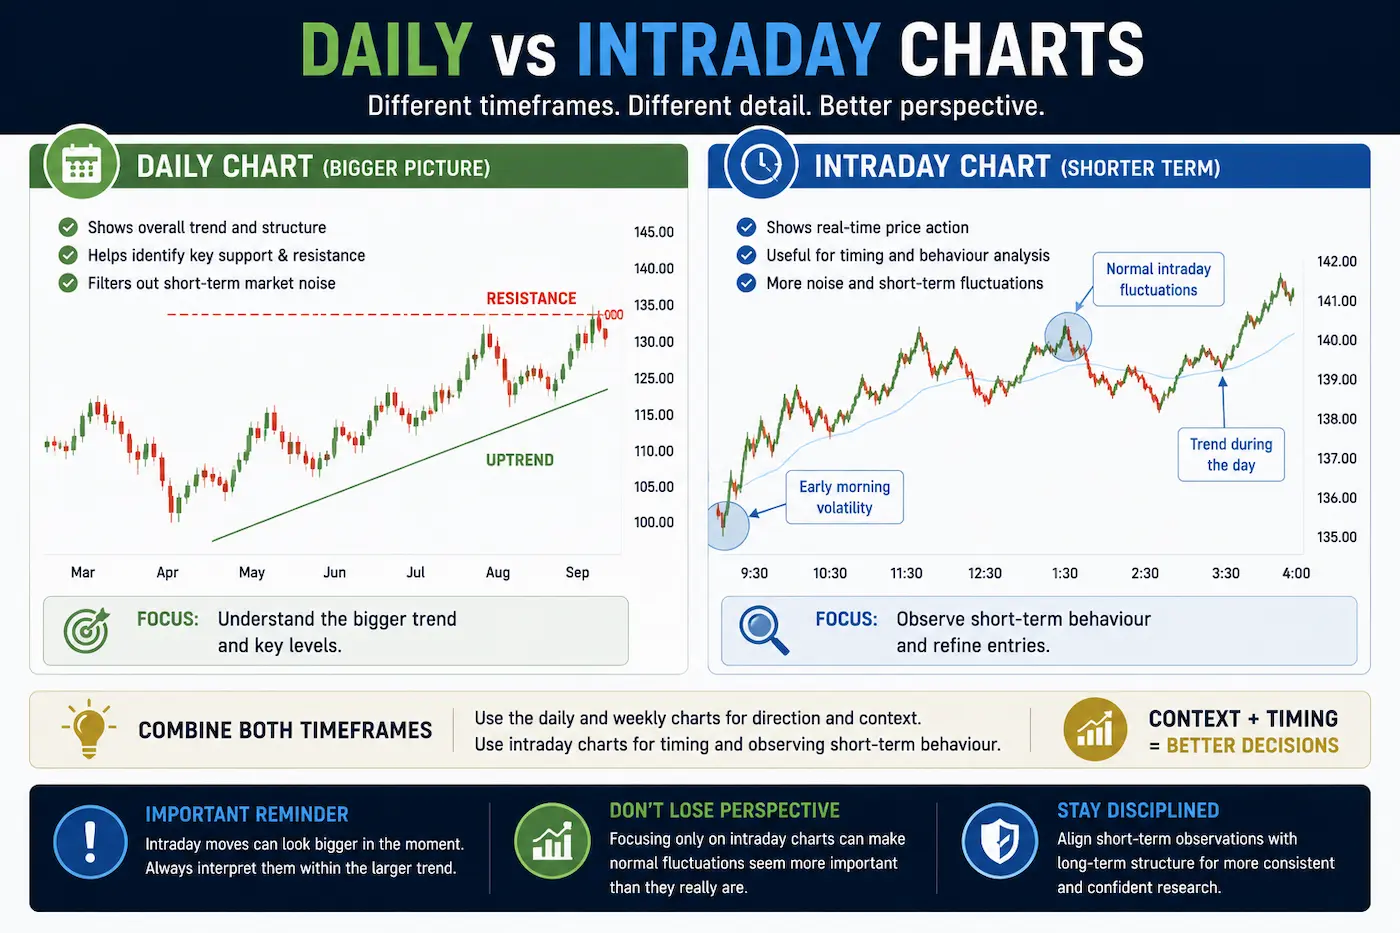
Some investors also use intraday charts to observe shorter-term market activity.
These charts can provide additional context regarding price behaviour during the trading day but should always be interpreted alongside the larger daily and weekly trends.
Focusing only on intraday movements can make normal market fluctuations appear more significant than they actually are.
Looking for Alignment
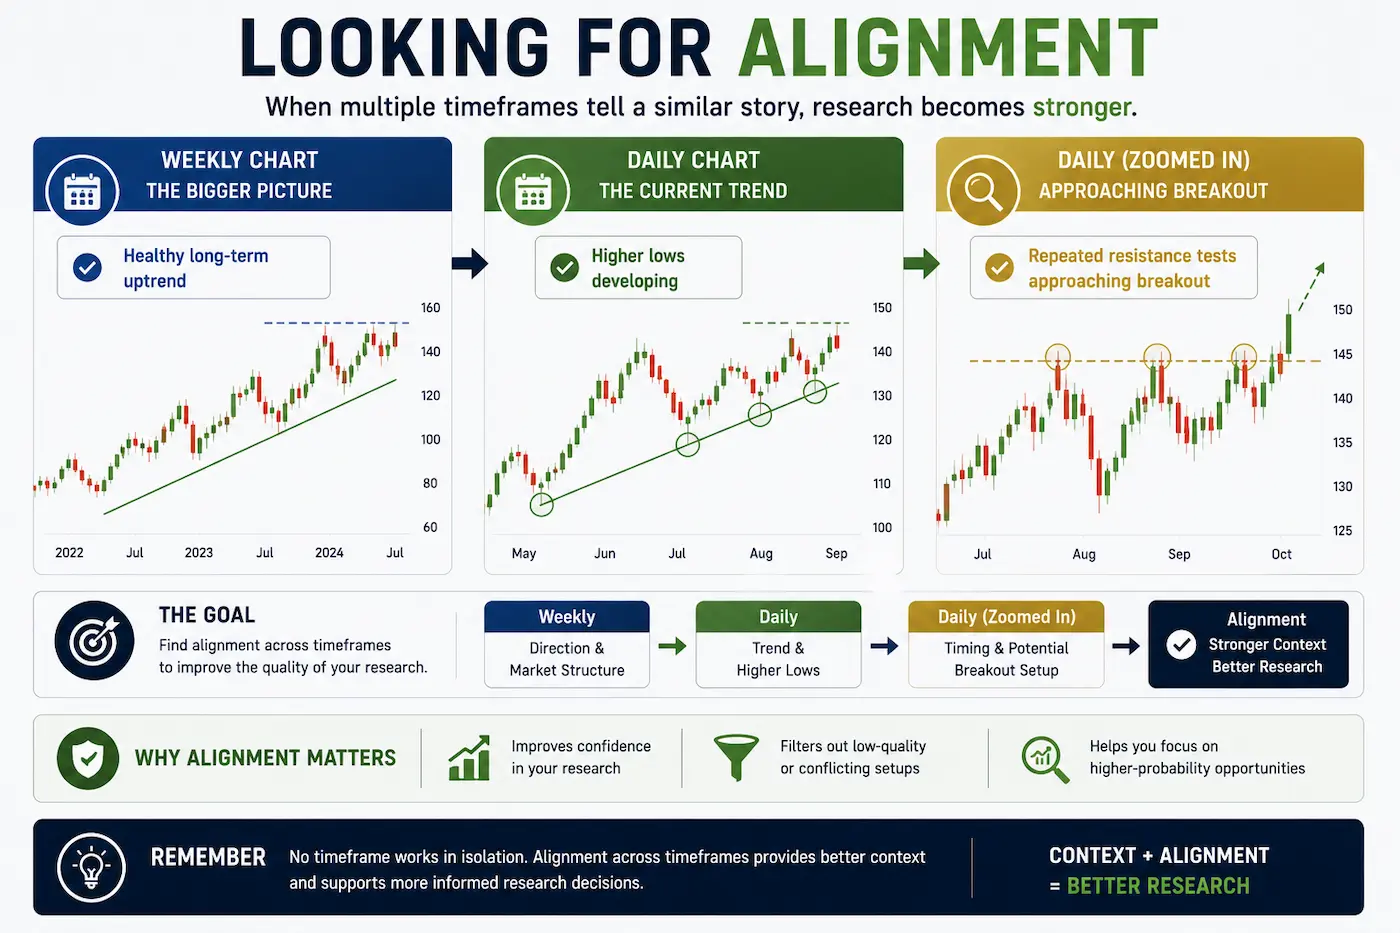
One objective of multi-timeframe analysis is identifying alignment between different chart periods.
For example, a stock may display:
- A healthy long-term uptrend on the weekly chart.
- Higher lows developing on the daily chart.
- Repeated resistance tests approaching a potential breakout.
When multiple timeframes tell a similar story, investors often gain greater confidence in their overall market research.
A stock may appear strong on a daily chart while still facing significant long-term resistance on the weekly timeframe.
Conflicting information does not necessarily mean a stock should be ignored. Instead, it highlights the importance of considering the broader picture before reaching conclusions.
Multi-Timeframe Analysis Inside EdgeBreak
EdgeBreak encourages members to combine scanner results with chart analysis across multiple timeframes.
A typical workflow might involve:
- Finding opportunities using the NASDAQ Scanner.
- Opening the stock in TradingView.
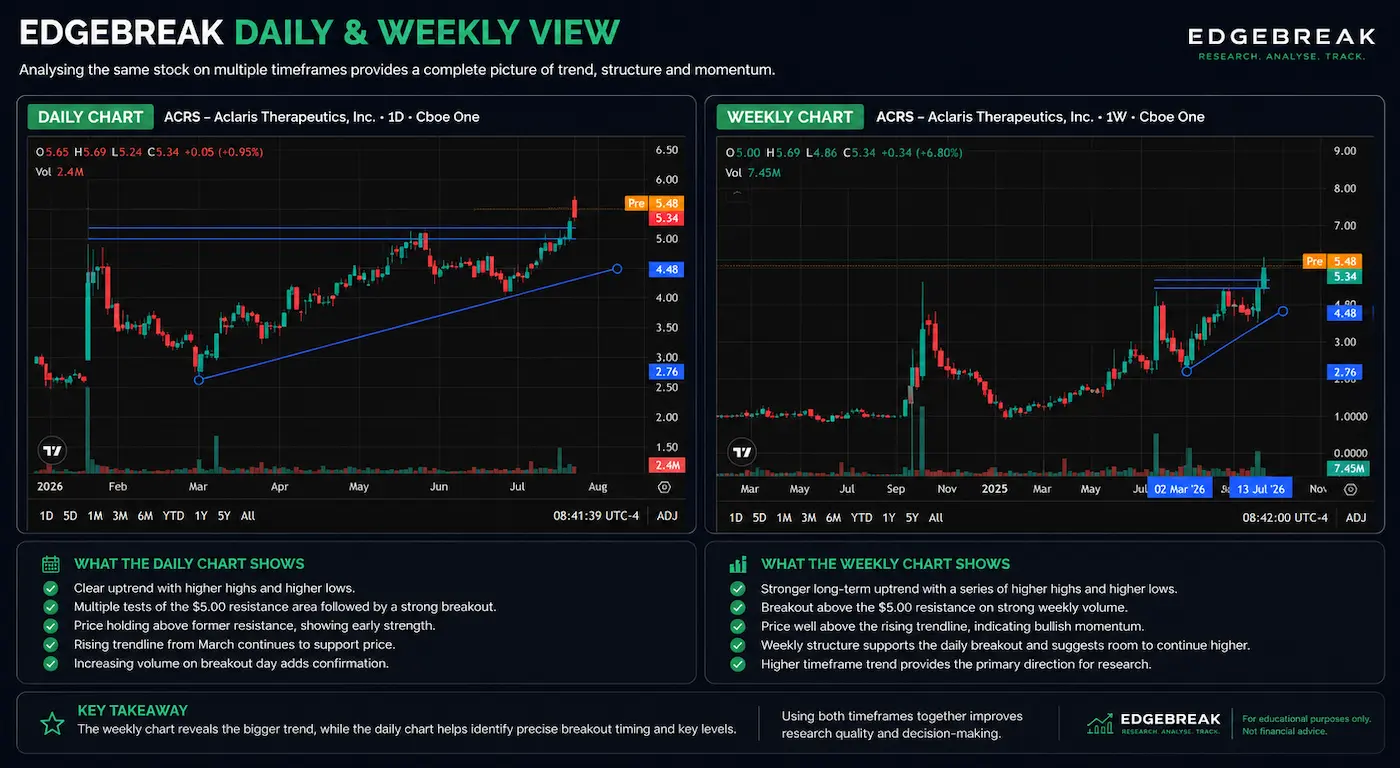
- Reviewing the weekly trend.
- Studying the daily market structure.
- Monitoring resistance, higher lows and volume behaviour.
- Saving promising candidates to My Workspace.
This process helps ensure that research is based on a complete understanding of market structure rather than a single chart.
Focus on Context
Multi-timeframe analysis is not about finding perfect agreement between every chart.
Its purpose is to provide context.
Understanding the larger trend before analysing smaller price movements helps investors develop a more balanced and disciplined research process.
Lesson Summary
Multi-timeframe analysis provides a broader understanding of market behaviour by combining weekly, daily and shorter-term charts. Rather than relying on a single timeframe, investors can use multiple perspectives to better understand trend direction, resistance levels and developing breakout opportunities.
Key Takeaways
- The weekly chart provides long-term context.
- The daily chart is the foundation of EdgeBreak research.
- Intraday charts provide additional detail but should not replace larger trends.
- Look for alignment between multiple timeframes.
- Always consider the bigger picture before researching a breakout.
Practical Exercise
Open three stocks from your EdgeBreak watchlist.
- View each stock on the weekly chart.
- Switch to the daily chart.
- Identify the main trend on both timeframes.
- Mark any major resistance levels.
- Decide whether the daily structure supports the long-term trend.
Research Reminder
Multi-timeframe analysis provides additional context for market research but should never be used as a prediction tool. EdgeBreak combines chart analysis with structured market research to support independent decision-making and does not provide financial advice or investment recommendations.
Continue Your Journey
Lesson 3.2 – Identifying Institutional Accumulation
Discover how institutional accumulation can develop before significant price movements, learn the characteristics commonly associated with professional buying activity, and understand why accumulation is an important part of the EdgeBreak research framework.